SASE FEL experiment at SPARC (2009)
In the SASE FEL experiment at SPARC_LAB the intensity of the FEL radiation has been observed and measured after each of the six undulator modules and the exponential growth has been well reproduced even not reaching saturation. The beam used in the SASE FEL experiment was obtained with a longitudinally flattop laser pulse, with a length of 6–8 ps (FWHM) with about 400 pC of charge and a beam energy of 150 MeV. The reconstructed longitudinal phase space, measured by means of the RF deflector, is shown in Fig. 1. A complete list of electron beam parameters is detailed in Table 1 .
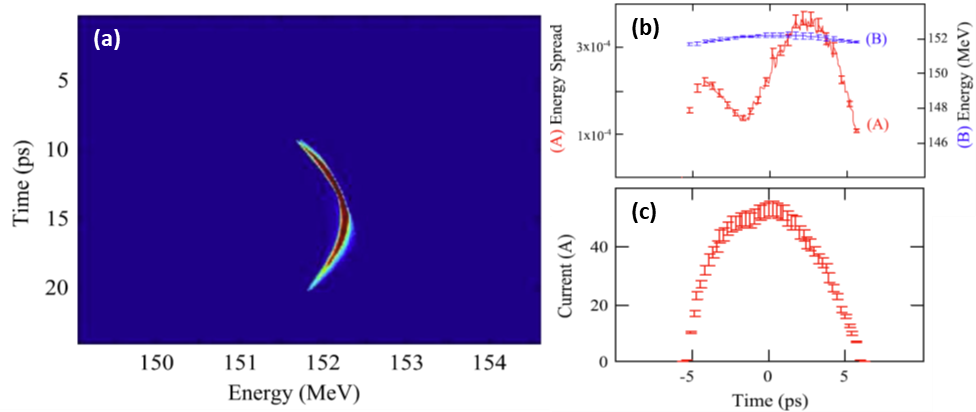
Figure 1: (a) Phase space of the e-beam measured with time/energy dispersion induced by rf-deflector (in time) and a spectrometer dipole (in energy), (b) beam energy spread (A) and beam energy (B) and (c) beam current as a function of time along the bunch.
| Beam energy | 150 MeV |
| Relative energy spread (rms) | 9 x 10⁻⁴ |
| Slice energy spread (rms) | 2 x 10⁻⁴ |
| Bunch length (rms) | 2.6 ps |
| Electron charge | 400 pC |
| Beam current | 53 A |
| Repetition rate | 10 Hz |
| Vertical emittance | 2.9 mm mrad |
| Horizontal emittance | 2.5 mm mrad |
Table 1 – Electron beam parameters for the SASE FEL experiment at SPARC_LAB
Such a beam was injected in the SPARC_LAB undulator tuned at a resonant wavelength of 500 nm, with an undulator strength $K_u$=2.07. The undulator focusing was reached by imposing a periodic condition to the transverse beam over the focusing-defocusing (FODO) and by imposing that the transverse average Twiss βx,y coefficients in the two directions are equals.
Spectra of the FEL radiation have been measured together with the pulse energy, as a function of the position in the undulator, just turning off the FEL interaction by progressively suppressing the amplification process, by detuning one by one the undulator modules starting from the begin of the line. This procedure allowed the measure of the spectrum generated in the remaining modules, with an increasing number of undulators participating in amplification, while keeping unchanged the geometry of the radiation detection.
The most relevant parameters for the FEL radiation are summarized in Table 2. The evolution of the spectral profile and pulse energy is shown in Fig. 2. Also the third harmonic at 166 nm has been detected.
Results for the fundamental ad third harmonic have been compared with the most used numerical codes in the field, showing a very good agreement with simulations.
| Undulato parameter K | 2.07 |
| Wavelegnth | 500 nm |
| Gain length | 0.7 m |
| Pierce parameter (effective) | 1.8 x 10⁻³ |
| Pulse bandwidth | 0.3% |
| Pule energy | 0.01 mJ |
| Spot size (rms) | 1 mm |
Table 2 – Measured parameters of the output FEL radiation.
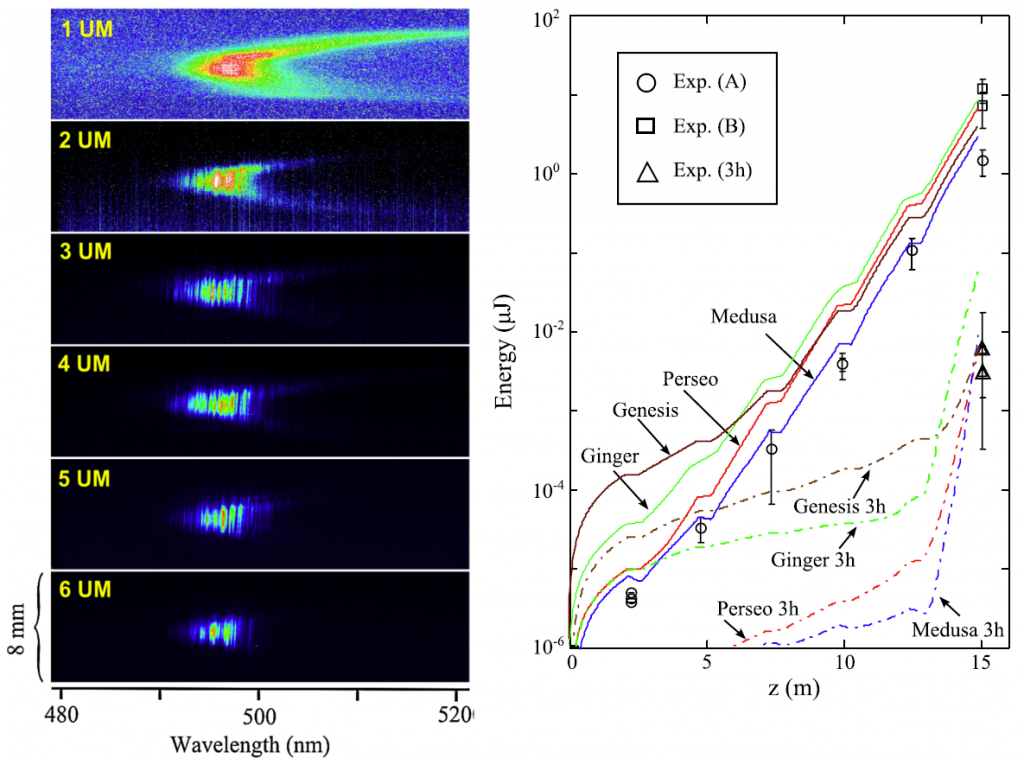
Figure 2: (a) SASE spectrum evolution during the exponential growth. The vertical axis in each picture indicates the position
on the vertical entrance slit of the spectrometer, the horizontal is the wavelength. Images are normalized to the intensity peak value. The six spectra are obtained with varying the number of undulator modules (on the upper left corner). The spiky nature of the SASE radiation is already apparent in the spectrum obtained with only two undulator sections. (b) Pulse energy growth in the undulator. Circle black symbols are the measured data on the fundamental. Squares are data after an optimization of the laser to injector phase. Triangles are for the third harmonic. Lines represent simulations with PERSEO (red), GENESIS 1.3 (brown), MEDUSA (blue), and GINGER (green); continuous line for the fundamental, dash-dotted ones for the 3rd harmonic (More details in the reference article).
Reference:
“Self-amplified spontaneous emission for a single pass free-electron laser”, L.Giannessi et al, Phys. Rev. ST Accel. Beams vol. 14 (2011), pag. 060712 doi: 10.1103/PhysRevSTAB.14.060712
SASE experiments